
BMK S-Series Spatial Transcriptomics Cell Segmentation Demo Data — Results
BMKMANU S1000 Mouse Testis Demo Data — Results
2023-05-05
BMK Releases a Cross-Species PBMC Dataset Covering 7 Species and 14 Samples!
2023-07-21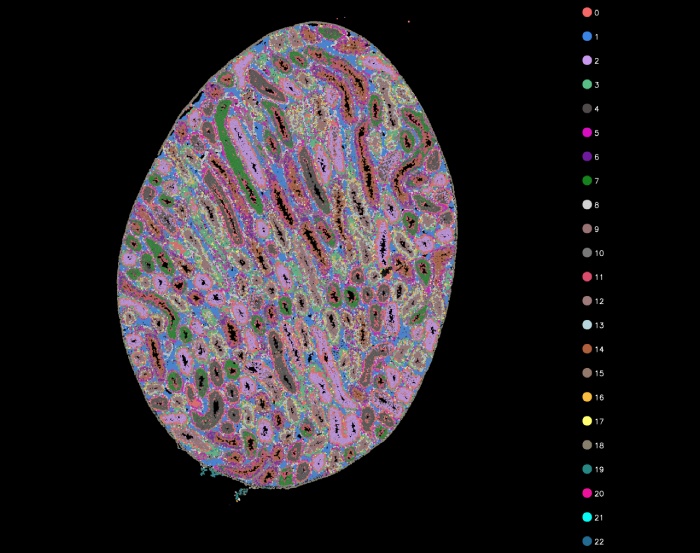
Data Statistics
Table 1. Sequencing Reads Statistics
| Type | Number | Percent(%) |
|---|---|---|
| Number of Reads | 1,338,426,735 | |
| Valid Barcodes | 1,262,816,067 | 94.35 |
| Valid UMIs | 1,329,064,839 | 99.3 |
| Final Valid Reads | 1,262,615,019 | 94.34 |
[su_expand more_text=”More” less_text=”Close” height=”60″ link_style=”underlined” more_icon=”icon: sort-desc” less_icon=”icon: sort-up”]
▶Notes for Table 1
Number of Reads: total number of reads;
Valid Barcodes: number of reads containing valid barcodes;
Valid UMIs: number of reads containing valid UMIs;
Final Valid Reads: final number of reads containing both a valid barcode and a valid UMI.
[/su_expand]
Table 2. Data Alignment
| Type | Percent(%) |
|---|---|
| Reads Mapped to Genome | 97.63% |
| Reads Mapped Confidently to Genome | 91.24% |
| Reads Mapped Confidently to Intergenic Regions | 5.49% |
| Reads Mapped Confidently to Intronic Regions | 6.09% |
| Reads Mapped Confidently to Exonic Regions | 79.66% |
| Reads Mapped Confidently to Transcriptome | 81.42% |
[su_expand more_text=”More” less_text=”Close” height=”60″ link_style=”underlined” more_icon=”icon: sort-desc” less_icon=”icon: sort-up”]
▶Notes for Table 2
Reads Mapped to Genomes: proportion of reads aligned to the reference genome out of total reads;
Reads Mapped Confidently to Genome: proportion of reads aligned to the reference genome and supported by transcript GTF information;
Reads Mapped Confidently to Intergenic Regions: proportion of reads aligned to intergenic regions;
Reads Mapped Confidently to Intronic Regions: proportion of reads aligned to intronic regions;
Reads Mapped Confidently to Exonic Regions: proportion of reads aligned to exonic regions;
Reads Mapped Confidently to Transcriptome: proportion of reads confidently mapped to known reference transcripts out of total reads.[/su_expand]
Spot-related Statistics
Summary
Table 3. Spot Statistics
| Tpyes | Values |
|---|---|
| Sequencing Saturation | 88.33% |
| Percent of Spots Under Tissue | 39.00% |
| Fraction Reads in Spots Under Tissue | 85.71% |
[su_expand more_text=”More” less_text=”Close” height=”60″ link_style=”underlined” more_icon=”icon: sort-desc” less_icon=”icon: sort-up”]
▶ Notes for Table 3
Sequencing Saturation: sequencing saturation;
Percent of Spots Under Tissue: proportion of spots located under the tissue section;
Fraction Reads in Spots Under Tissue: proportion of reads in spots located under the tissue section.[/su_expand]
Table 4. Spot Statistics at Different Levels
| Level | 13 (100μm) | 7 (50μm) | 6 (42μm) | 5 (35μm) | 4 (27μm) | 3 (20μm) | 2(10μm) | 1 (5μm) |
|---|---|---|---|---|---|---|---|---|
| Number of SupSpots | 1,991 | 7,357 | 10,263 | 15,315 | 25,227 | 49,148 | 133,376 | 724,620 |
| Median Genes per SupSpot | 8,787 | 4,377 | 3,566 | 2,740 | 1,929 | 1,160 | 498 | 106 |
| Median UMI Counts per SupSpot | 46,584 | 12,475 | 8,975 | 6,021 | 3,642 | 1,840 | 655 | 120 |
| Total Genes Detected | 37,427 | 37,421 | 37,419 | 37,423 | 37,422 | 37,419 | 37,422 | 37,423 |
[su_expand more_text=”More” less_text=”Close” height=”60″ link_style=”underlined” more_icon=”icon: sort-desc” less_icon=”icon: sort-up”]
▶ Notes for Table 4
Level: resolution level;
Number of SupSpots: number of supspots formed by merging one or more spots;
Median Genes per SupSpot: median number of genes per SupSpot;
Median UMI Counts per SupSpot: median UMI counts per SupSpot;
Total Genes Detected: total number of genes.
[/su_expand]
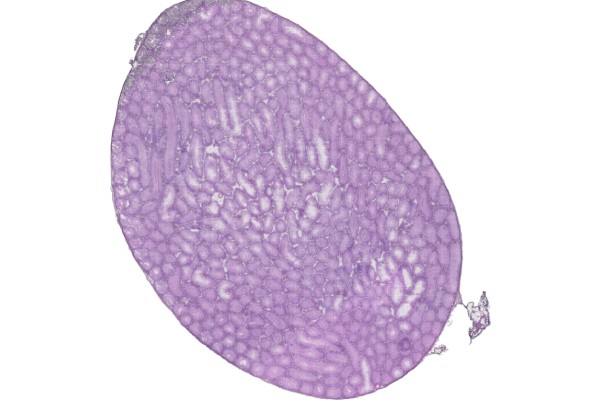
H&E-stained tissue section image

Figure 1. H&E-stained tissue section image
Tissue UMI count statistics

Figure 2. Tissue UMI count statistics
▶ Resolution Level Description

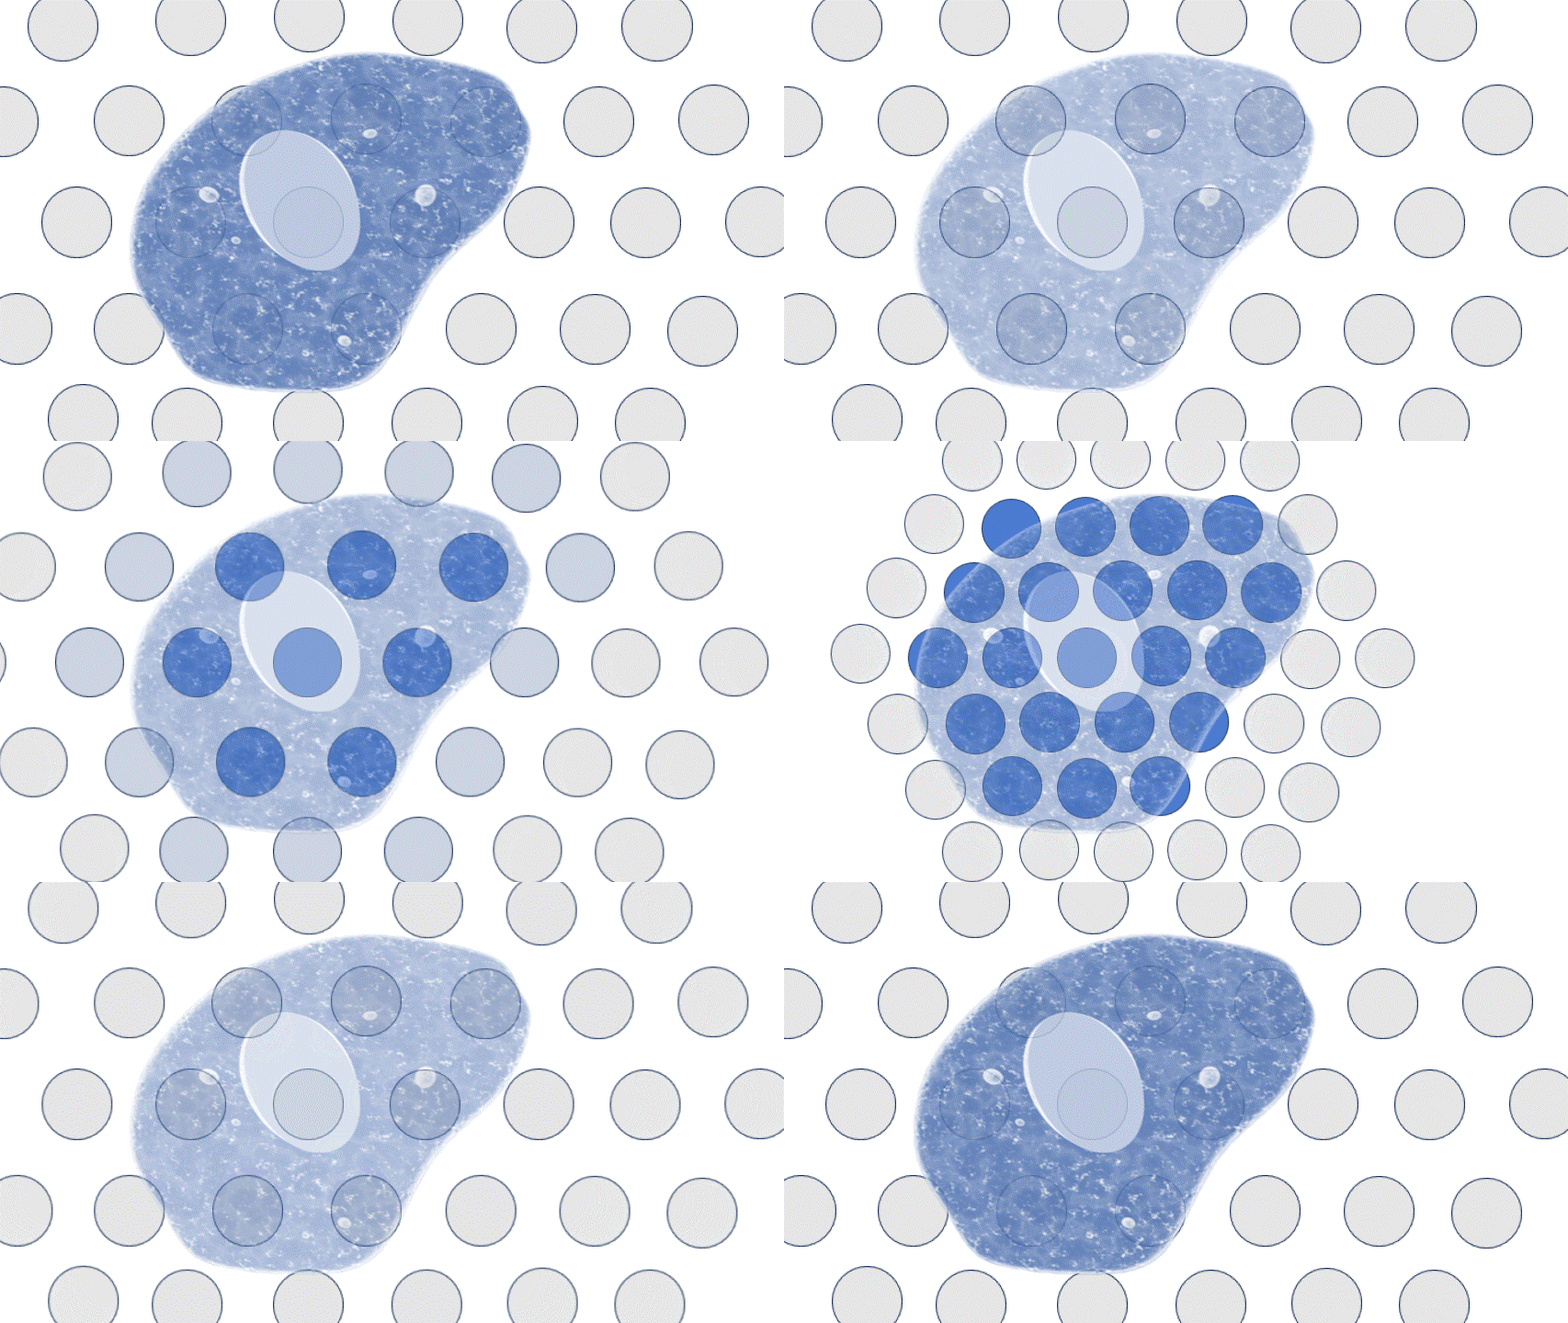
Supspot level versus number of spots
Supspot level resolution table
| SupSpot Level | Resolution | Number of Spots |
|---|---|---|
| 13 | 100μm | 469 |
| 7 | 50μm | 127 |
| 6 | 42μm | 91 |
| 5 | 35μm | 61 |
| 4 | 27μm | 37 |
| 3 | 20μm | 19 |
| 2 | 10μm | 7 |
| 1 | 5μm | 1 |
Clustering Analysis

l13-cluster plot

l7-cluster plot

l5-cluster plot
Cell Segmentation
Summary
Table 5. Cell Segmentation Statistics
| Type | Value |
|---|---|
| Number of Cells | 137,671 |
| Median Genes per Cells | 645 |
| Median UMI Counts per Cells | 870 |
| Total Genes Detected | 37,319 |
[su_expand more_text=”More” less_text=”Close” height=”60″ link_style=”underlined” more_icon=”icon: sort-desc” less_icon=”icon: sort-up”]
▶ Notes for Table 5
Number of Cells: number of cells obtained by segmentation;
Median Genes per Cells: median number of genes per cell;
Median UMI Counts per Cells: median UMI counts per cell;
Total Genes Detected: total number of genes.
[/su_expand]

Tissue section fluorescence image

Tissue section H&E segmentation

Tissue section fluorescence segmentation

Cell segmentation cluster plot