
Bmk_Space_mapping.R Operating Instructions
Warning: Trying to access array offset on value of type bool in /www/wwwroot/10.3.128.39/wp-content/themes/betheme/functions/theme-functions.php on line 1338
Warning: Trying to access array offset on value of type bool in /www/wwwroot/10.3.128.39/wp-content/themes/betheme/functions/theme-functions.php on line 1343
Warning: Trying to access array offset on value of type bool in /www/wwwroot/10.3.128.39/wp-content/themes/betheme/functions/theme-functions.php on line 1365
Warning: Trying to access array offset on value of type bool in /www/wwwroot/10.3.128.39/wp-content/themes/betheme/functions/theme-functions.php on line 1366
Warning: Trying to access array offset on value of type bool in /www/wwwroot/10.3.128.39/wp-content/themes/betheme/functions/theme-functions.php on line 1367
Cluster plot Software User Guide
2022-08-03
BSTMatrix ONT Pipeline User Guide
2022-09-27Warning: Trying to access array offset on value of type bool in /www/wwwroot/10.3.128.39/wp-content/themes/betheme/functions/theme-functions.php on line 1338
Warning: Trying to access array offset on value of type bool in /www/wwwroot/10.3.128.39/wp-content/themes/betheme/functions/theme-functions.php on line 1343
Warning: Trying to access array offset on value of type bool in /www/wwwroot/10.3.128.39/wp-content/themes/betheme/functions/theme-functions.php on line 1365
Warning: Trying to access array offset on value of type bool in /www/wwwroot/10.3.128.39/wp-content/themes/betheme/functions/theme-functions.php on line 1366
Warning: Trying to access array offset on value of type bool in /www/wwwroot/10.3.128.39/wp-content/themes/betheme/functions/theme-functions.php on line 1367
1. Open the script file
source(‘xxx’) #’xxx’ is the script path, for example ’C:/Users/R/Desktop/qq.R’
2. Create a Seurat object and plot the spatial cluster map
FilePath : folder path containing “barcode.tsv.gz, barcode_pos.tsv.gz, feature.tsv.gz, matrix.mtx.gz”
barcode_pos_file : file path of “barcode_pos.tsv.gz”
out_path : output file directory
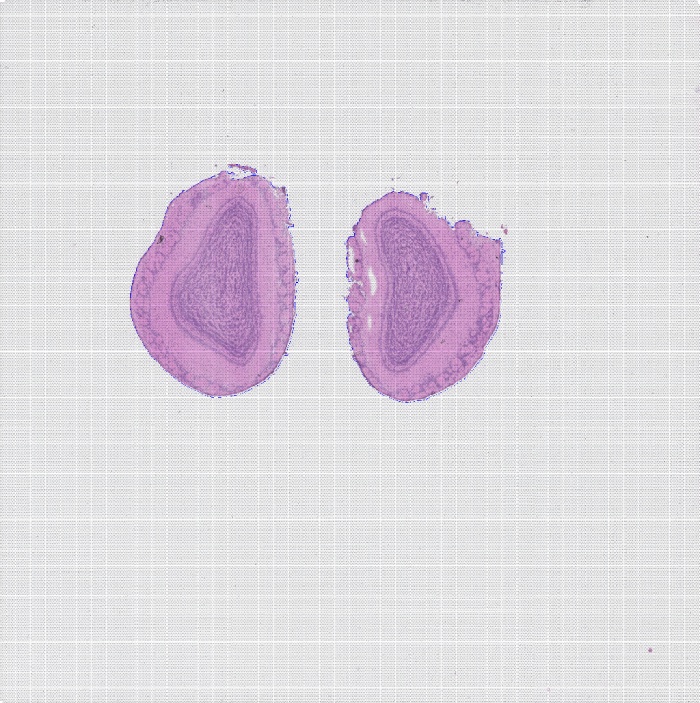
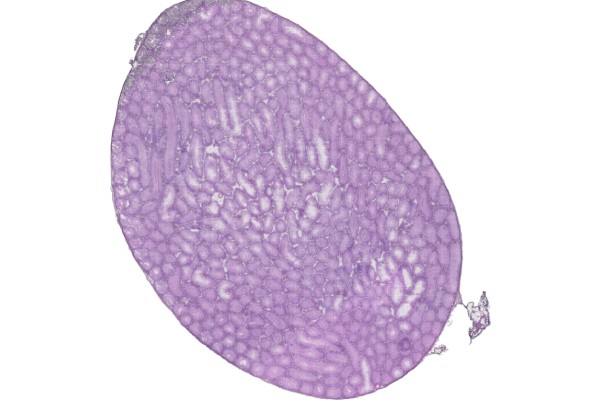
png_path : HE staining image (.png format). If the file is in .tiff format it must be converted; note that the resolution can be reduced during conversion to avoid read failures caused by an excessively large .png file
Note that the Seurat object must be named “object”
object <- Create_object(
FilePath = ‘E:/AAAWork/BSTViewer_project/subdata/L13_heAuto/’,
barcode_pos_file = ‘E:/AAAWork/BSTViewer_project/subdata/L13_heAuto/barcodes_pos.tsv.gz’,
out_path = ‘C:/Users/R/Desktop/temp/Cluster/’,
png_path = ‘C:/Users/R/Desktop/temp/he.png’,
min.cells = 10, # A gene is retained only if expressed in at least n cells; adjustable, default 10
min.features = 100, # A cell is retained only if it has at least n genes; adjustable, default 100
dims = 1:30, # Number of PCs used for downstream analysis; adjustable, default 1:30
resolution = 0.5, # Sets the “granularity” of downstream analysis; higher values yield more clusters; adjustable, default 0.5
point_size = 3, # Point size; adjust according to the matrix file level — the smaller the level, the smaller the value
width = 12, # Width of the output image; adjustable, default 12
height = 5, # Height of the output image; adjustable, default 5
Cluster = T, # Whether to perform clustering analysis; default F
label = T # Whether to output a labeled cluster plot
)

umap_cluster_label
3. UMI statistics
object <- Create_object(
FilePath = ‘E:/AAAWork/BSTViewer_project/subdata/L13_heAuto/’,
barcode_pos_file = ‘E:/AAAWork/BSTViewer_project/subdata/L13_heAuto/barcodes_pos.tsv.gz’,
out_path = ‘C:/Users/R/Desktop/temp/UMI_stat/’,
png_path = ‘C:/Users/R/Desktop/temp/he.png’,
point_size = 3, # Same as above
width = 12, # Same as above
height = 5, # Same as above
UMI_stat = T) # Whether to compute UMI statistics

UMI_viol_heatmap
4. nFeature statistics
object <- Create_object(
FilePath = ‘E:/AAAWork/BSTViewer_project/subdata/L13_heAuto/’,
barcode_pos_file = ‘E:/AAAWork/BSTViewer_project/subdata/L13_heAuto/barcodes_pos.tsv.gz’,
out_path = ‘C:/Users/R/Desktop/temp/Gene_stat/’,
png_path = ‘C:/Users/R/Desktop/temp/he.png’,
point_size = 2, # Same as above
width = 12, # Same as above
height = 5, # Same as above
nFeature_stat = T) # Whether to compute nFeature statistics

nFeature_viol_heatmap
5. Output the marker genes of each cluster and plot the expression heatmap of individual genes
object <- Create_object(
FilePath = ‘E:/AAAWork/BSTViewer_project/subdata/L13_heAuto/’,
barcode_pos_file = ‘E:/AAAWork/BSTViewer_project/subdata/L13_heAuto/barcodes_pos.tsv.gz’,
out_path = ‘C:/Users/R/Desktop/temp/Single_gene_1/’,
png_path = ‘C:/Users/R/Desktop/temp/he.png’,
point_size = 2, # Same as above
Gene_stat = T, # Whether to plot marker genes
top_gene = 1, # Number of top marker genes taken per cluster; adjustable, but the value should not be set too large
min.pct = 0.25, # Minimum fraction of cells in which a gene must be expressed in any two cell groups; adjustable
logfc.threshold = 0.25, # Fold-change threshold; adjustable
markpic_width = 8, # Width of the violin plot and tSNE plot
markpic_height = 12, # Height of the violin plot and tSNE plot
)

Heatmap list
6. Plot the cluster map of one or several genes
object <- Create_object(
FilePath = ‘E:/AAAWork/BSTViewer_project/subdata/L13_heAuto/’,
barcode_pos_file = ‘E:/AAAWork/BSTViewer_project/subdata/L13_heAuto/barcodes_pos.tsv.gz’,
out_path = ‘C:/Users/R/Desktop/temp/Test/Single_gene_2/’,
png_path = ‘C:/Users/R/Desktop/temp/he.png’,
point_size = 2.6, # Same as above
Gene_stat = T, # Whether to plot marker genes
Custom_gene = T, # Whether to plot custom genes
alpha_continuous = c(0.5,1) # Adjust the transparency range according to gene expression
gene_list = c(‘Hpca’)) # Names of the genes to plot; multiple genes can be entered

Hpca
Select a black background for highlighting
object <- Create_object(
FilePath = ‘E:/AAAWork/BSTViewer_project/subdata/L13_heAuto/’,
barcode_pos_file = ‘E:/AAAWork/BSTViewer_project/subdata/L13_heAuto/barcodes_pos.tsv.gz’,
out_path = ‘C:/Users/R/Desktop/temp/Test/Single_gene_2/’,
png_path = ‘C:/Users/R/Desktop/temp/he.png’,
point_size = 2.6, # Same as above
Gene_stat = T, # Whether to plot marker genes
Custom_gene = T, # Whether to plot custom genes
dark_background = T, # Black background
gene_list = c(‘Hpca’)) # Names of the genes to plot; multiple genes can be entered

Hpca
7. Plot a single cluster
object <- Create_object(
FilePath = ‘E:/AAAWork/BSTViewer_project/subdata/L13_heAuto/’,
barcode_pos_file = ‘E:/AAAWork/BSTViewer_project/subdata/L13_heAuto/barcodes_pos.tsv.gz’,
out_path = ‘C:/Users/R/Desktop/temp/TestL6/single/’,
png_path = ‘C:/Users/R/Desktop/temp/he.png’,
point_size = 2, # Same as above
Single_cluster = T # Whether to plot a single cluster
)

cluster1

Single cluster list
Related posts

Warning: Trying to access array offset on value of type bool in /www/wwwroot/10.3.128.39/wp-content/themes/betheme/functions/theme-functions.php on line 1467