
BMKMANU S1000 Mouse Testis Demo Data — Results

BMKManu DG1000 Human PBMC Sequencing Data Details
2022-11-23
BMK S-Series Spatial Transcriptomics Cell Segmentation Demo Data — Results
2023-07-05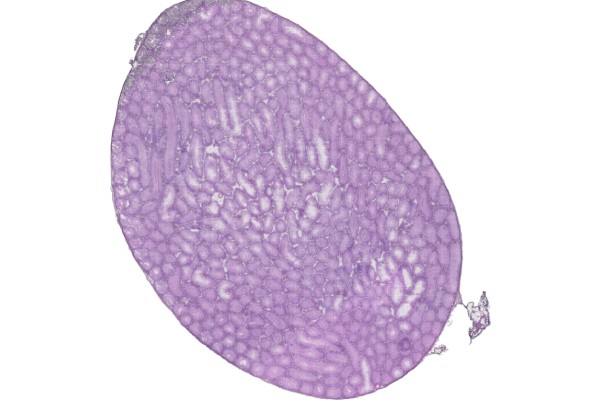
【Data Information】
Sequencing Platform: Illumina
Sample Type: mouse testis section
Release Date: 2023/4/26
【Demo Data Results】
1, Sequencing read statistics are shown in the table below:
Table 1. Sequencing Data Statistics
| Type | Values |
| Number of Reads | 598,040,914 |
| Valid Barcodes | 569,325,963 |
| Valid UMIs | 592,672,836 |
Notes:
Number of Reads: total number of reads;
Valid Barcodes: number of reads containing a valid barcode;
Valid UMIs: number of reads containing valid UMIs.
2. Data Alignment
Table 2. Alignment Results Statistics
| Type | Values |
| Reads Mapped to Genome | 97.25% |
| Reads Mapped Confidently to Genome | 90.34% |
| Reads Mapped Confidently to Intergenic Regions | 5.08% |
| Reads Mapped Confidently to Intronic Regions | 4.92% |
| Reads Mapped Confidently to Exonic Regions | 80.34% |
| Reads Mapped Confidently to Transcriptome | 80.85% |
Notes:
Reads Mapped to Genomes: proportion of reads aligned to the reference genome out of total reads;
Reads Mapped Confidently to Genome: proportion of reads aligned to the reference genome and supported by transcript GTF information;
Reads Mapped Confidently to Intergenic Regions: proportion of reads aligned to intergenic regions;
Reads Mapped Confidently to Intronic Regions: proportion of reads aligned to intronic regions;
Reads Mapped Confidently to Exonic Regions: proportion of reads aligned to exonic regions;
Reads Mapped Confidently to Transcriptome: proportion of reads aligned to known reference transcripts.
3, Image Processing
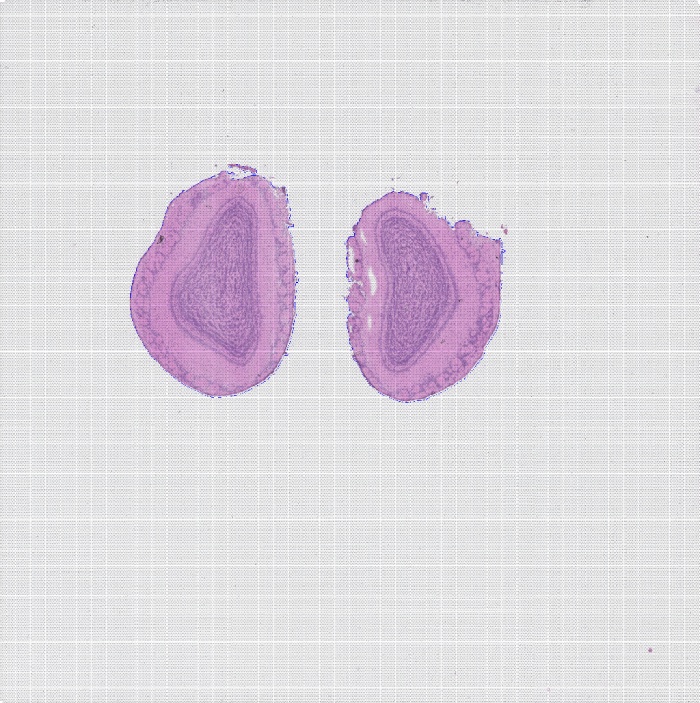
Every slide contains spots. During the experiment they are covered by the tissue section, but the section covers only part of the spots, so only gene expression from the spots beneath the covered area is captured.

Figure 1. H&E-stained tissue section image
4, Spot Statistics
Gene expression quantification in spatial transcriptomics is mainly achieved through UMI counting. UMIs make it possible to distinguish whether a read is a biological replicate or a technical replicate, effectively removing PCR effects. After removing duplicate UMIs for the genes under each barcode, the number of unique UMIs represents the expression level of the cell’s genes. The analysis statistics are as follows:
Table 3. Spot Statistics
| Type | Values |
| Sequencing Saturation | 50.55% |
| Percent of Spots Under Tissue | 57.28% |
| Fraction Reads in Spots Under Tissue | 73.70% |
Notes:
Sequencing Saturation: sequencing saturation;
Percent of Spots Under Tissue: proportion of spots located under the tissue section;
Fraction Reads in Spots Under Tissue: proportion of reads in spots located under the tissue section.

Table 4. Statistics of Genes Captured per Spot at Different Levels
Notes:
Level: resolution level;
Number of SupSpots: number of supspots formed by merging one or more spots;
Median Genes per SupSpot: median number of genes per SupSpot;
Median UMI Counts per SupSpot: median UMI counts per SupSpot;
Total Genes Detected: total number of genes.

Figure 2. Tissue UMI count statistics
Related posts

Warning: Trying to access array offset on value of type bool in /www/wwwroot/10.3.128.39/wp-content/themes/betheme/functions/theme-functions.php on line 1467