
S1000 Seurat Analysis Pipeline

Animal Skin Single-Cell Demo Data
2022-07-15Cluster plot Software User Guide
2022-08-03
[su_heading size=”16″]Software Dependencies and Installation[/su_heading]
python, version 3.8 or above. Download link:https://www.python.org/downloads/
Related modules: numpy, cv2, pandas, seaborn, sys, getopt
R and RStudio installation. Download link:https://cran.r-project.org/
Related R packages: Seurat, dplyr, tibble, ggplot2
[su_heading size=”16″]Input Data Preparation[/su_heading]
matrix.mtx.gz, genes.tsv.gz (or features.tsv.gz), and barcodes.tsv.gz
barcodes_pos.tsv.gz
HE image
[su_heading size=”16″]Running the Scripts[/su_heading]
1) Open the seurat_for_bmkmanu_S1000.R script in RStudio and modify the parameters in the parameter initialization section
FilePath: input path; the input directory must contain the matrix.mtx.gz, genes.tsv.gz (or features.tsv.gz) and barcodes.tsv.gz files
outdir: output path
res: different resolution values produce different numbers of clusters; the larger the value, the more clusters. The default value is 0.5
MinCell: filtering parameter, number of cells
MinFeatures: filtering parameter, number of genes
2) Run the seurat_for_bmkmanu_S1000.R script to obtain the clustering results and marker genes
Result files:
cluster.csv clustering result file
marker_gene.csv marker gene file
UMAP.pdf/png UMAP cluster plot
t-SNE.pdf/png t-SNE cluster plot
markers_heatmap.pdf/png marker gene heatmap
3) Run the bmplot.py script to obtain the cluster plot
python bmplot.py -e ./he.tif -p /path/to/posfile/barcodes_pos.tsv.gz -c /path/to/clsuter/file/cluster.csv -o ./out_cluster_st.tif
The -e parameter specifies the HE image file
The -p parameter specifies the barcodes_pos.tsv.gz file
The -c parameter specifies the cluster.csv file generated in the previous step
The -o parameter specifies the output cluster image file name
Result files:
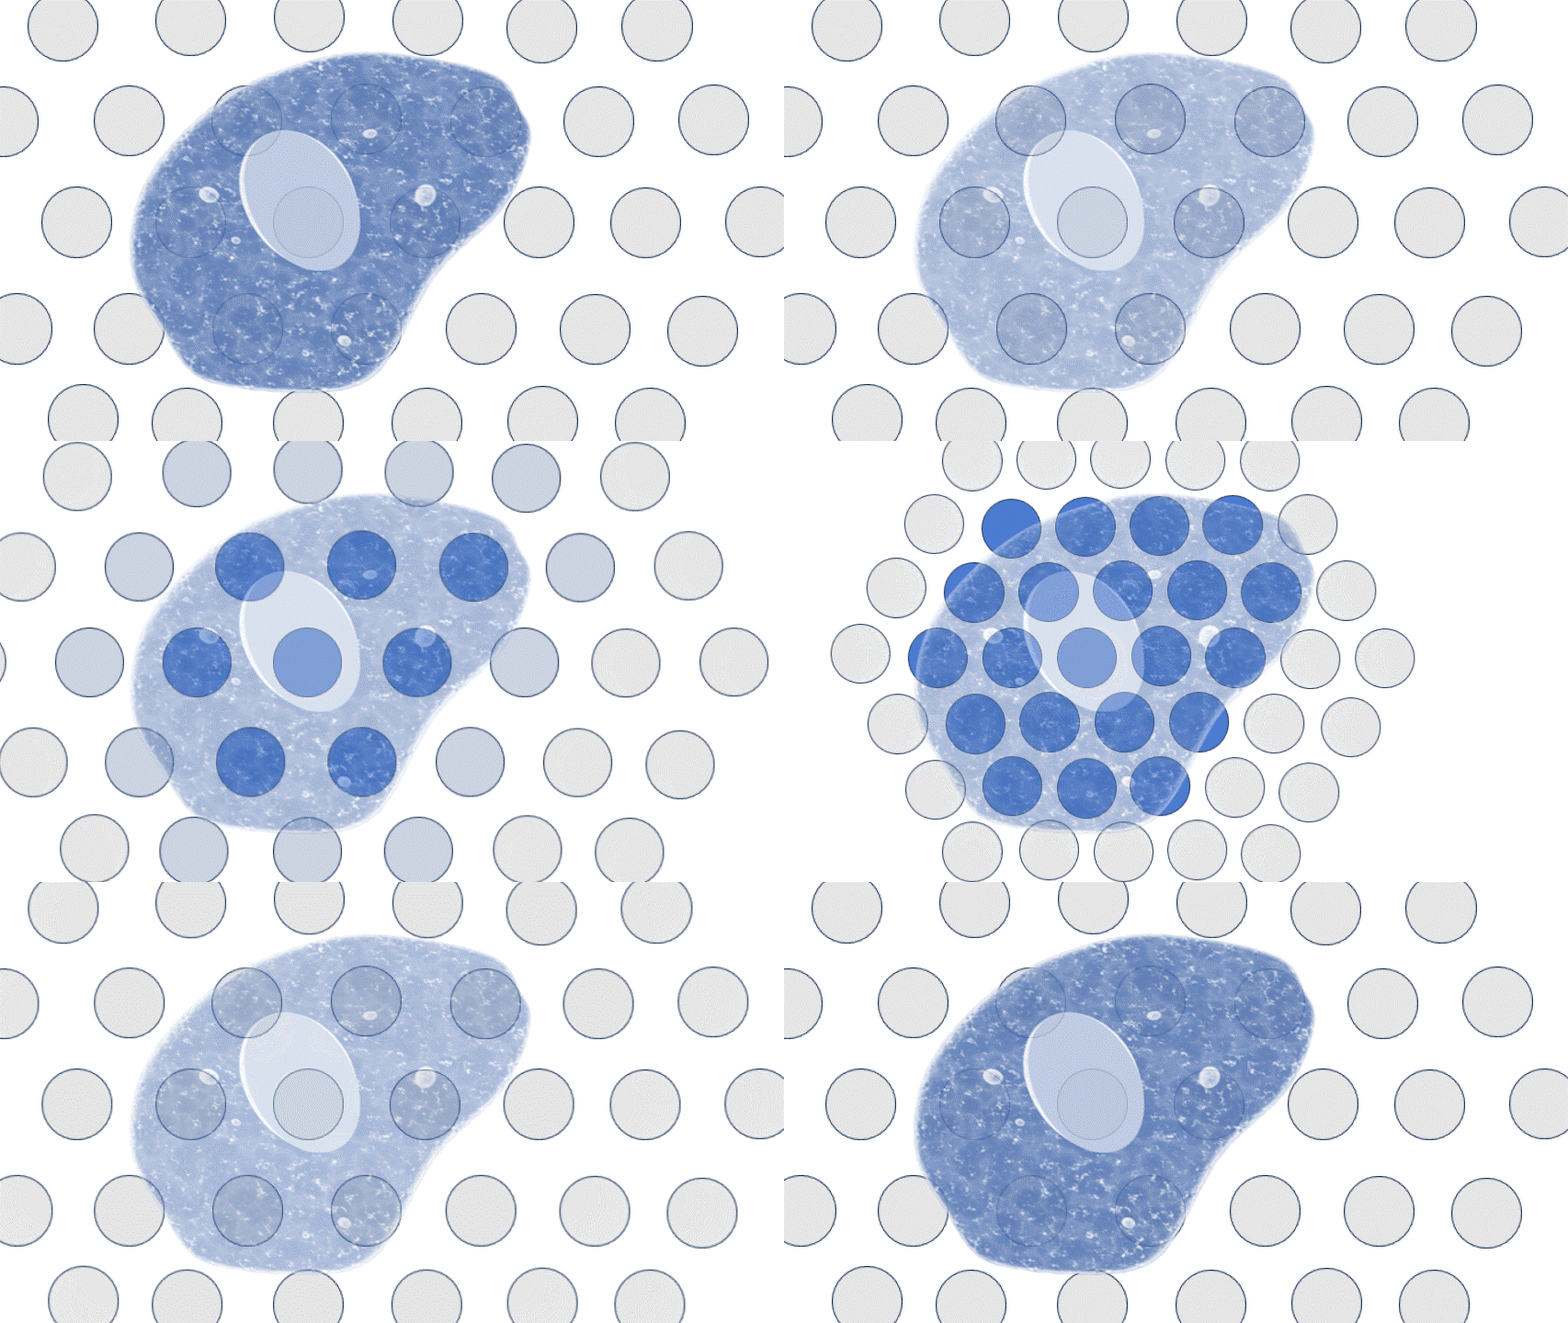
out_cluster_st.tif cluster plot on the tissue
4) Run the marker_gene_Plot_rm_he.py script to obtain the expression heatmap of marker genes in each cluster
python marker_gene_Plot_rm_he.py -e ./he.tif -i ./outdir/ -m marker_gene.csv -o outdir
The -e parameter specifies the HE image file
The -i parameter specifies the input directory, which must contain the barcodes_pos.tsv.gz, matrix.mtx.gz and features.tsv.gz files
-m is the path of the marker_gene.csv file obtained in step 2)
-o is the output directory
[su_heading size=”16″]Result files[/su_heading]
n_umi_dist.tif heatmap of marker genes in each cluster