

Product Overview
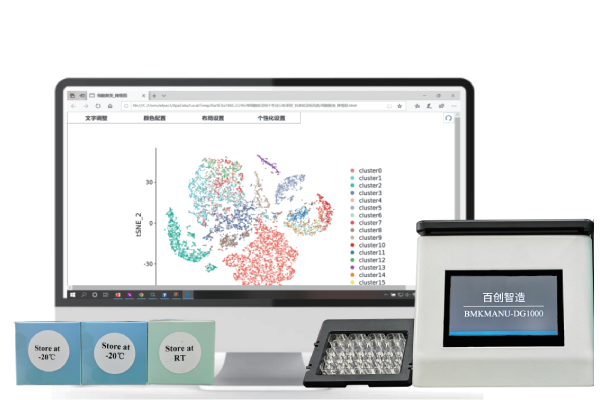
BMKMANU DG1000 Advantages

Compact and Portable

Fast Operation

Flexible Sample Loading

Compatible with Larger Cell Diameters
Workflow

Capture Probe

Outsourced Service vs. In-House Operation
| Single-Cell Sequencing Workflow | Outsourced Service | In-House |
| Experiment Turnaround | 〜10d | 1〜2d |
| Analysis Turnaround | 〜10d | 1〜2d |
| Shipping Required | Shipping takes 1-2 days and may reduce cell viability | No shipping; dissociation on site, preserving high cell viability |
Short Turnaround
Preserved Cell Viability
Lower Cost
Benchmark Data

1. Sequencing Reads Statistics
Sequencing reads statistics are shown below:
Table1 Sequencing Data Statistics
|
Type |
Values 221020-4-2 |
Values 21020-8-7-1 |
|
Number of Reads |
399,967,594 |
378,584,610 |
|
Valid Barcodes |
339,047,468 |
323,897,836 |
|
Valid UMIs |
395,738,572 |
374,651,123 |
Note:
Number of Reads: total number of reads;
Valid Barcodes: number of reads containing a valid barcode;
Valid UMIs: number of reads containing a valid UMI.
2. Read Alignment
Alignment statistics are shown below:
Table 2 Alignment Statistics
|
Type |
Values 221020-4-2 |
Values 21020-8-7-1 |
|
Reads Mapped to Genome |
96.01% |
95.52% |
|
Reads Mapped Confidently to Genome |
80.77% |
81.7% |
|
Reads Mapped Confidently to Intergenic Regions |
1.69% |
2.58% |
|
Reads Mapped Confidently to Intronic Regions |
15.62% |
29.15% |
|
Reads Mapped Confidently to Exonic Regions |
63.44% |
49.96% |
|
Reads Mapped Confidently to Transcriptome |
71.64% |
71.57% |
Note:
Reads Mapped to Genomes: proportion of reads mapped to the reference genome among total reads;
Reads Mapped Confidently to Genome: proportion of reads confidently mapped to the reference genome and supported by transcript GTF information;
Reads Mapped Confidently to Intergenic Regions: proportion of reads confidently mapped to intergenic regions;
Reads Mapped Confidently to Intronic Regions: proportion of reads confidently mapped to intronic regions;
Reads Mapped Confidently to Exonic Regions: proportion of reads confidently mapped to exonic regions;
Reads Mapped Confidently to Transcriptome: proportion of reads confidently mapped to known reference transcripts.
3. Analysis Statistics
Cell analysis statistics are shown below:
Table3 CellStatistics
|
Type |
Values 221020-4-2 |
Values 21020-8-7-1 |
|
Estimated Number of Cells |
7,104 |
11,012 |
|
Median UMI Counts per Cell |
7,261 |
6,434 |
|
Median Genes per Cell |
2,624 |
2,678.5 |
|
Total Genes Detected |
37,416 |
41,208 |
|
Sequencing Saturation |
73.22% |
65.99% |
|
Fraction Reads in Cells |
77.39% |
83.64% |
Note:
Estimated Number of Cells: number of cells detected;
Median UMI Counts per Cell: median UMI count per cell;
Median Genes per Cell: median gene count per cell;
Total Genes Detected: total number of genes;
Sequencing Saturation: sequencing saturation;
Fraction Reads in Cells: proportion of reads in cells after filtering relative to total reads.

Figure 2. Barcode rank plot for 221020-4-2

Figure 2. Barcode rank plot for 21020-8-7-1