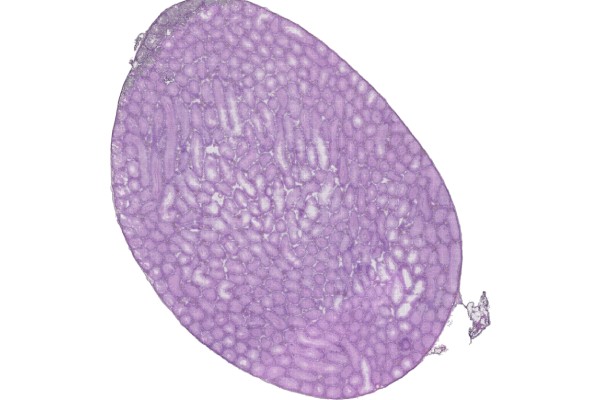
BMKMANU S1000 Spatial Transcriptomics Cell Segmentation Demo Data
BMKManu S-Series Spatial Transcriptomics Cell Segmentation Demo — Download
2023-07-21Bmk_Space_mapping.R Operating Process
2023-09-19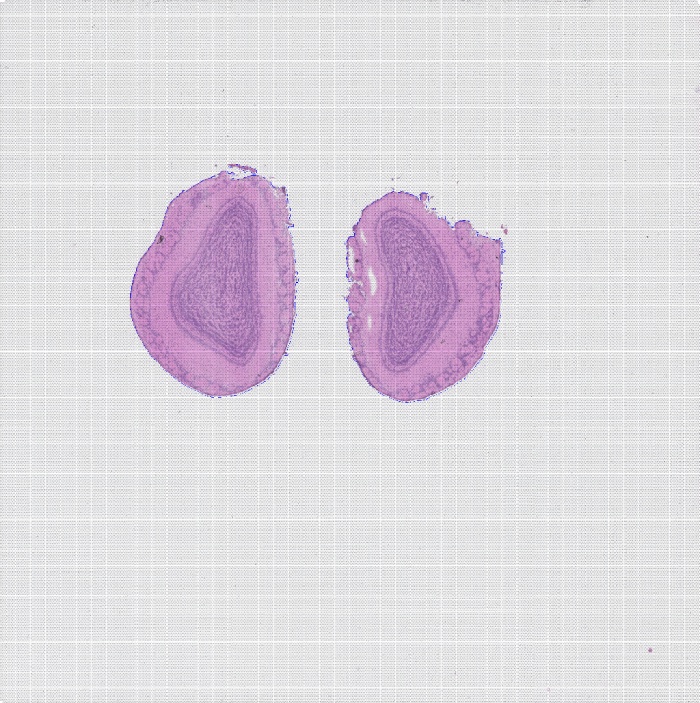
Data Statistics
Table 1. Sequencing Reads Statistics
| Type | Number | Percent(%) |
|---|---|---|
| Number of Reads | 337,531,256 | |
| Valid Barcodes | 316,152,592 | 93.67 |
| Valid UMIs | 335,911,164 | 99.52 |
| Final Valid Reads | 316,136,080 | 93.66 |
[su_expand more_text=”More” less_text=”Close” height=”20″ link_style=”underlined” more_icon=”icon: sort-desc” less_icon=”icon: sort-up”]Notes for Table 1:
Number of Reads: total number of reads;
Valid Barcodes: number of reads containing valid barcodes;
Valid UMIs: number of reads containing valid UMIs;
Final Valid Reads: final number of reads containing both a valid barcode and a valid UMI.
[/su_expand]
Table 2. Data Alignment
| Type | Percent(%) |
|---|---|
| Reads Mapped to Genome | 97.38% |
| Reads Mapped Confidently to Genome | 84.94% |
| Reads Mapped Confidently to Intergenic Regions | 1.64% |
| Reads Mapped Confidently to Intronic Regions | 2.76% |
| Reads Mapped Confidently to Exonic Regions | 80.53% |
| Reads Mapped Confidently to Transcriptome | 79.15% |
[su_expand more_text=”More” less_text=”Close” height=”20″ link_style=”underlined” more_icon=”icon: sort-desc” less_icon=”icon: sort-up”]
Notes for Table 2:
Reads Mapped to Genomes: proportion of reads aligned to the reference genome out of total reads;
Reads Mapped Confidently to Genome: proportion of reads aligned to the reference genome and supported by transcript GTF information;
Reads Mapped Confidently to Intergenic Regions: proportion of reads aligned to intergenic regions;
Reads Mapped Confidently to Intronic Regions: proportion of reads aligned to intronic regions;
Reads Mapped Confidently to Exonic Regions: proportion of reads aligned to exonic regions;
Reads Mapped Confidently to Transcriptome: proportion of reads aligned to known reference transcripts.
[/su_expand]
Spot-related Statistics
[su_tabs][su_tab title=”Summary” disabled=”no” anchor=”” url=”” target=”blank” class=””]
| Tpyes | Values |
|---|---|
| Sequencing Saturation | 87.97% |
| Percent of Spots Under Tissue | 11.00% |
| Fraction Reads in Spots Under Tissue | 91.21% |
[su_expand more_text=”More” less_text=”Close” height=”20″ link_style=”underlined” more_icon=”icon: sort-desc” less_icon=”icon: sort-up”]
Notes for Table 3:
Sequencing Saturation: sequencing saturation;
Percent of Spots Under Tissue: proportion of spots located under the tissue section;
Fraction Reads in Spots Under Tissue: proportion of reads in spots located under the tissue section.
[/su_expand]
| Level | 13 (100μm) | 7 (50μm) | 6 (42μm) | 5 (35μm) | 4 (27μm) | 3 (20μm) | 2 (10μm) | 1 (5μm) |
| Number of SupSpots | 562 | 2,075 | 2,888 | 4,310 | 7,102 | 13,851 | 37,548 | 213,000 |
| Median Genes per SupSpot | 9,082 | 4,841 | 3,962 | 3,053 | 2,137 | 1,284 | 551 | 111 |
| Median UMI Counts per SupSpot | 54,596 | 14,645 | 10,474 | 6,998 | 4,221 | 2,131 | 767 | 130 |
| Total Genes Detected | 29,175 | 29,170 | 29,182 | 29,181 | 29,175 | 29,191 | 29,190 | 29,196 |
[su_expand more_text=”More” less_text=”Close” height=”20″ link_style=”underlined” more_icon=”icon: sort-desc” less_icon=”icon: sort-up”]
Notes for Table 4:
Level: resolution level;
Number of SupSpots: number of supspots formed by merging one or more spots;
Median Genes per SupSpot: median number of genes per SupSpot;
Median UMI Counts per SupSpot: median UMI counts per SupSpot;
Total Genes Detected: total number of genes.
[/su_expand]
[su_expand more_text=”More” less_text=”Close” height=”20″ link_style=”underlined” more_icon=”icon: sort-desc” less_icon=”icon: sort-up”]
Resolution Level Description:

Supspot level versus number of spots |
|
[/su_expand]
[/su_tab] [su_tab title=”H&E-stained tissue section image” disabled=”no” anchor=”” url=”” target=”blank” class=””]

Figure 1. H&E-stained tissue section image
[/su_tab] [su_tab title=”Tissue UMI count statistics” disabled=”no” anchor=”” url=”” target=”blank” class=””]

Figure 2. Tissue UMI count statistics
[/su_tab][/su_tabs]
Clustering Analysis
[su_tabs][su_tab title=”L13 cluster plot” disabled=”no” anchor=”” url=”” target=”blank” class=””]

Figure 3. Cluster plot
[/su_tab] [su_tab title=”L7 cluster plot” disabled=”no” anchor=”” url=”” target=”blank” class=””]

Figure 3. Cluster plot
[/su_tab] [su_tab title=”L5 cluster plot” disabled=”no” anchor=”” url=”” target=”blank” class=””]

Figure 3. Cluster plot
[/su_tab][/su_tabs]
Cell Segmentation
[su_tabs][su_tab title=”Summary” disabled=”no” anchor=”” url=”” target=”blank” class=””]
| Type | Value |
|---|---|
| Number of Cells | 17,567 |
| Median Genes per Cells | 1,165 |
| Median UMI Counts per Cells | 1,786 |
| Total Genes Detected | 29,059 |
[su_expand more_text=”More” less_text=”Close” height=”20″ link_style=”underlined” more_icon=”icon: sort-desc” less_icon=”icon: sort-up”]
Notes for Table 5:
Number of Cells: number of cells obtained by segmentation;
Median Genes per Cells: median number of genes per cell;
Median UMI Counts per Cells: median UMI counts per cell;
Total Genes Detected: total number of genes.
[/su_expand]
[/su_tab] [su_tab title=”Tissue section fluorescence image” disabled=”no” anchor=”” url=”” target=”blank” class=””]

Figure 4. Tissue section fluorescence image
[/su_tab] [su_tab title=”Tissue section H&E segmentation” disabled=”no” anchor=”” url=”” target=”blank” class=””]

Figure 5. Tissue section H&E segmentation
[/su_tab] [su_tab title=”Tissue section fluorescence segmentation” disabled=”no” anchor=”” url=”” target=”blank” class=””]

Figure 6. Tissue section fluorescence segmentation
[/su_tab] [su_tab title=”Cell segmentation cluster plot” disabled=”no” anchor=”” url=”” target=”blank” class=””]

Figure 7. Cell segmentation cluster plot
[/su_tab][/su_tabs]
Related posts

Warning: Trying to access array offset on value of type bool in /www/wwwroot/10.3.128.39/wp-content/themes/betheme/functions/theme-functions.php on line 1467