
BMKManu DG1000 Human PBMC Sequencing Data Details
BMKMANU S1000 Mouse Embryo Head Demo Data — Results
2022-11-23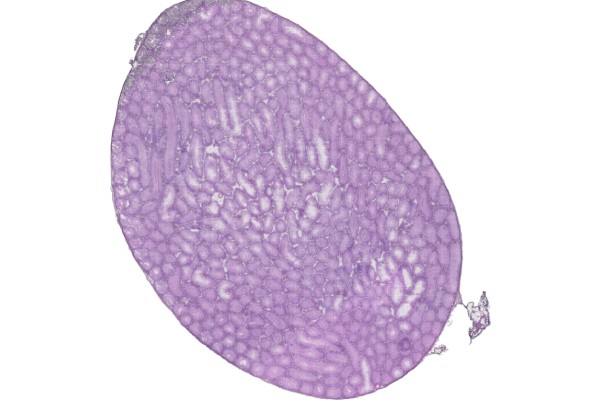
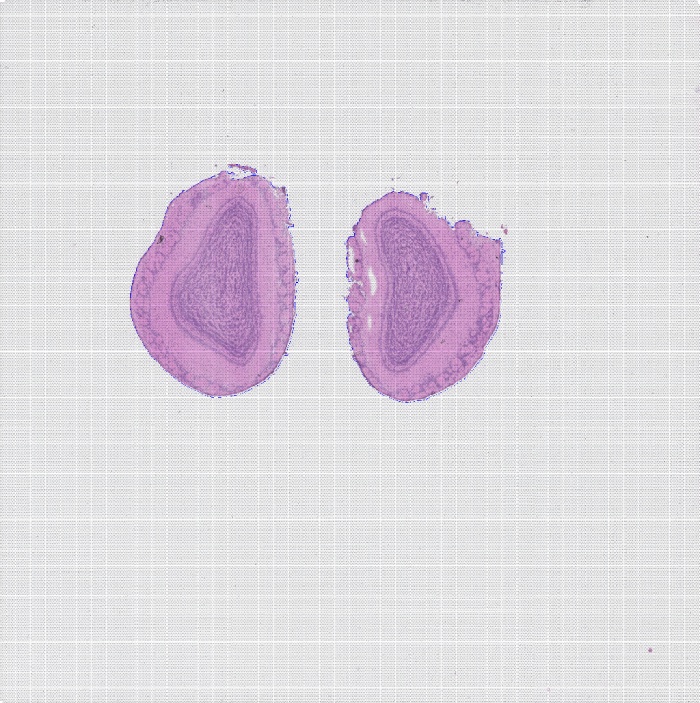
BMKMANU S1000 Mouse Testis Demo Data — Results
2023-05-05
Sequencing read statistics
Sequencing read statistics are shown in the table below:
| Type | Values |
| Number of Reads | 399,967,594 |
| Valid Barcodes | 339,047,468 |
| Valid UMIs | 395,738,572 |
Notes:
Number of Reads: total number of reads;
Valid Barcodes: number of reads containing a valid barcode;
Valid UMIs: number of reads containing valid UMIs.
Read alignment
Alignment statistics are shown in the table below:
| Type | Values |
| Reads Mapped to Genome | 96.01% |
| Reads Mapped Confidently to Genome | 80.77% |
| Reads Mapped Confidently to Intergenic Regions | 1.69% |
| Reads Mapped Confidently to Intronic Regions | 15.62% |
| Reads Mapped Confidently to Exonic Regions | 63.44% |
| Reads Mapped Confidently to Transcriptome | 71.64% |
Notes:
Reads Mapped to Genomes: proportion of reads aligned to the reference genome out of total reads;
Reads Mapped Confidently to Genome: proportion of reads aligned to the reference genome and supported by transcript GTF information;
Reads Mapped Confidently to Intergenic Regions: proportion of reads aligned to intergenic regions;
Reads Mapped Confidently to Intronic Regions: proportion of reads aligned to intronic regions;
Reads Mapped Confidently to Exonic Regions: proportion of reads aligned to exonic regions;
Reads Mapped Confidently to Transcriptome: proportion of reads aligned to known reference transcripts.
Analysis statistics
Cell analysis statistics are as follows:
| Type | Values |
| Estimated Number of Cells | 7,104 |
| Median UMI Counts per Cell | 7,261 |
| Median Genes per Cell | 2,624 |
| Total Genes Detected | 37,416 |
| Sequencing Saturation | 73.22% |
| Fraction Reads in Cells | 77.39% |
Notes:
Estimated Number of Cells: number of detected cells;
Median UMI Counts per Cell: median UMI count per cell;
Median Genes per Cell: median number of genes per cell;
Total Genes Detected: total number of genes;
Sequencing Saturation: sequencing saturation;
Fraction Reads in Cells: proportion of reads from cells after filtering out of total reads.

Barcode rank plot
Related posts

Warning: Trying to access array offset on value of type bool in /www/wwwroot/10.3.128.39/wp-content/themes/betheme/functions/theme-functions.php on line 1467