
Gene Marker Search and Cell Annotation Tool User Guide

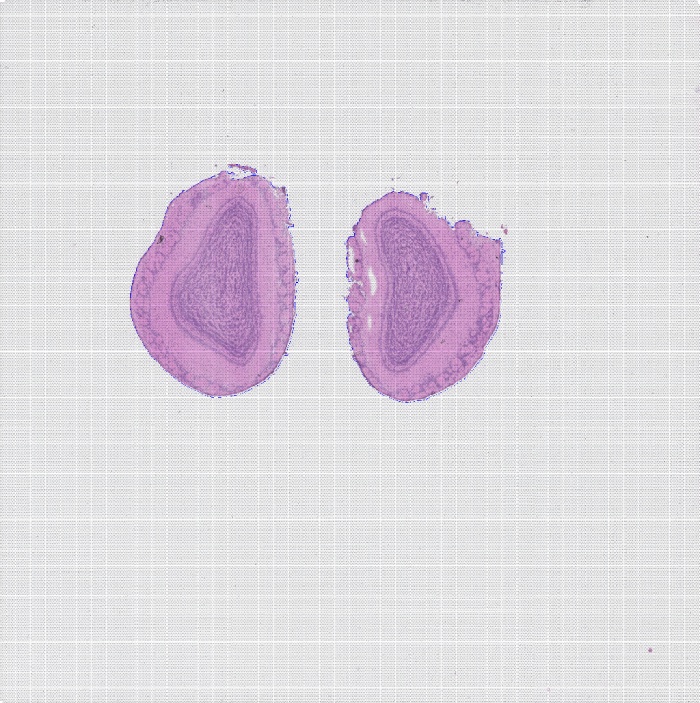
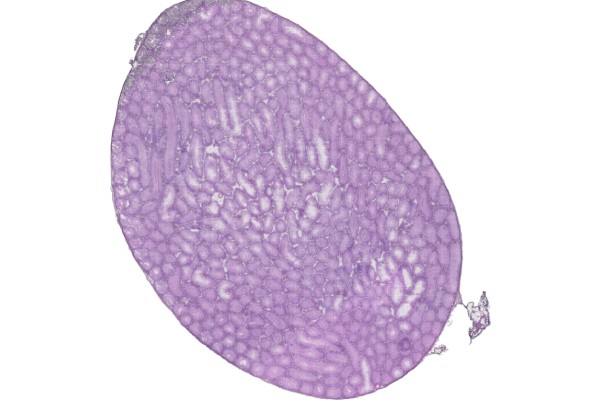
BMKManu S3000-FFPE Demo Data
2026-05-19
1. Environment configuration
conda install -c conda-forge r-base=4.3.1
conda install -c conda-forge r-optparse=1.7.5
conda install -c conda-forge r-dplyr=1.1.2
conda install -c conda-forge r-tidyr=1.3.1
2. Utility usage guide
2.1 Help information
Rscript cell_marker_cli.R -h
Usage: Rscript cell_marker_cli.R –mode MODE [options]
BMKMANU Cell Marker Database CLI – marker search and cell annotation tool
Options:
-m MODE, –mode=MODE
Run mode: marker_search (marker search) or celltype_anno (cell annotation) [required]
-s SPECIES, –species=SPECIES
Species (default: Human)
-t TISSUE, –tissue=TISSUE
Tissue (optional, no filtering by default)
-k MARKERS, –marker=MARKERS
Marker genes, multiple values separated by commas (marker_search mode only)
-g GENES, –genes=GENES
Input gene list, multiple values separated by commas or newlines (celltype_anno mode only)
-o FILE, –output=FILE
Output file path (CSV format; prints to console by default)
–top=N
Return the top N results in cell annotation mode (default: 20)
-d FILE, –data=FILE
Path to the MarkerGene data file (default: cell_marker_cli.txt in the same directory as the script)
–list-species
List all available species
–list-tissues
List all tissues under the specified species
-v, –verbose
Show verbose output
-h, –help
Show this help message and exit
2.2 Usage examples
3. Analysis results
Rscript cell_marker_cli.R --mode celltype_anno --species Human --genes 'CD3D,CD19,CD68'

╔══════════════════════════════════════════════════════════════╗
║BMKMANU Cell Marker Database - Command Line Tool              ║
╠══════════════════════════════════════════════════════════════╣
║Mode 1: marker_search - search cell types by species/tissue   ║
║Mode 2: celltype_anno - predict cell types from gene list     ║
╚══════════════════════════════════════════════════════════════╝

═══════════════════════════════════════════════════════════════
Predicted cell types (Top 20)
═══════════════════════════════════════════════════════════════
Input genes: 3
Matched genes: 3 (CD19, CD3D, CD68)
═══════════════════════════════════════════════════════════════
| Rank | Cell type | Tissue | Match count | Match rate | Matched genes |
|---|---|---|---|---|---|
| 1 | Activated CD4+ T cell | Blood | 2 | 66.7% | CD19, CD3D |
| 2 | Macrophage | Blood | 2 | 66.7% | CD19, CD68 |
| 3 | Monocyte | Peripheral blood | 2 | 66.7% | CD19, CD68 |
| 4 | Myeloid cell | Bone marrow | 2 | 66.7% | CD68, CD19 |
| 5 | Natural killer cell | Blood | 2 | 66.7% | CD19, CD3D |
| 6 | T cell | Blood | 2 | 66.7% | CD3D, CD19 |
| 7 | Activated B cell | Blood | 1 | 33.3% | CD19 |
| 8 | Activated CD8+ T cell | Blood | 1 | 33.3% | CD3D |
| 9 | Activated macrophage | Brain | 1 | 33.3% | CD68 |
| 10 | Activated microglial cell | Brain | 1 | 33.3% | CD68 |
| 11 | Activated microglial cell | Hippocampus | 1 | 33.3% | CD68 |
| 12 | Aged memory B cell | Peripheral blood | 1 | 33.3% | CD19 |
| 13 | Antibody-secreting cell | Peripheral blood | 1 | 33.3% | CD19 |
| 14 | Atypical memory B cell | Peripheral blood | 1 | 33.3% | CD19 |
| 15 | Atypical memory B cell | Venous blood | 1 | 33.3% | CD19 |
| 16 | B cell | Airway | 1 | 33.3% | CD19 |
| 17 | B cell | Bile duct | 1 | 33.3% | CD3D |
| 18 | B cell | Bladder | 1 | 33.3% | CD19 |
| 19 | B cell | Blood | 1 | 33.3% | CD19 |
| 20 | B cell | Blood vessel | 1 | 33.3% | CD19 |
───────────────────────────────────────────────────────────────
Top predictions:
#1 Activated CD4+ T cell (tissue: Blood) - matched 2/3 genes (66.7%)
#2 Macrophage (tissue: Blood) - matched 2/3 genes (66.7%)
#3 Monocyte (tissue: Peripheral blood) - matched 2/3 genes (66.7%)
#4 Myeloid cell (tissue: Bone marrow) - matched 2/3 genes (66.7%)
#5 Natural killer cell (tissue: Blood) - matched 2/3 genes (66.7%)
───────────────────────────────────────────────────────────────
✅ Done!
Notes:
1. After the script runs, the results are printed to the screen
2. To redirect the results, simply specify the -o parameter
3. Only one result set is shown here; users can explore the other usage examples on their own
4. By default, cell_marker_cli.txt in the same directory as the script is used; users can of course configure their own
Related posts
Warning: Trying to access array offset on value of type bool in /www/wwwroot/10.3.128.39/wp-content/themes/betheme/functions/theme-functions.php on line 1467