BMKMANU S1000空间转录组细胞分割Demo数据

百创智造S系列空间转录组细胞分割Demo下载
2023年7月21日
Bmk_Space_mapping.R Operating Process
2023年9月19日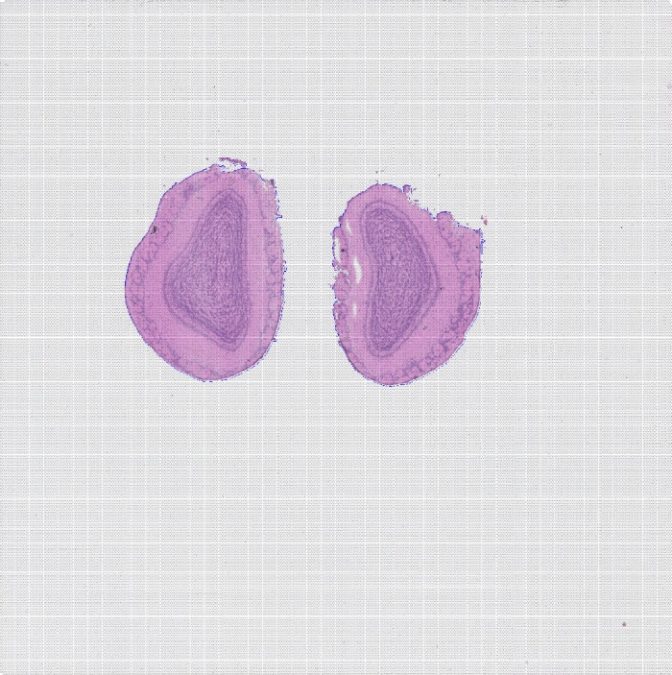
数据相关统计
表1 测序Reads统计
| Type | Number | Percent(%) |
|---|---|---|
| Number of Reads | 337,531,256 | |
| Valid Barcodes | 316,152,592 | 93.67 |
| Valid UMIs | 335,911,164 | 99.52 |
| Final Valid Reads | 316,136,080 | 93.66 |
表2 数据比对
| Type | Percent(%) |
|---|---|
| Reads Mapped to Genome | 97.38% |
| Reads Mapped Confidently to Genome | 84.94% |
| Reads Mapped Confidently to Intergenic Regions | 1.64% |
| Reads Mapped Confidently to Intronic Regions | 2.76% |
| Reads Mapped Confidently to Exonic Regions | 80.53% |
| Reads Mapped Confidently to Transcriptome | 79.15% |
Spots相关统计
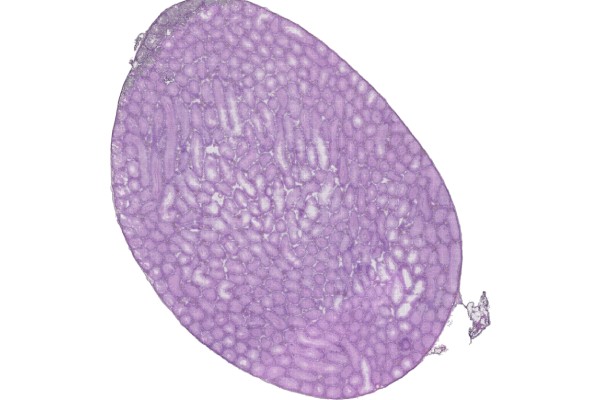
Summary组织切片HE染色图组织UMI count统计图
| Tpyes | Values |
|---|---|
| Sequencing Saturation | 87.97% |
| Percent of Spots Under Tissue | 11.00% |
| Fraction Reads in Spots Under Tissue | 91.21% |
| Level | 13 (100μm) | 7 (50μm) | 6 (42μm) | 5 (35μm) | 4 (27μm) | 3 (20μm) | 2 (10μm) | 1 (5μm) |
| Number of SupSpots | 562 | 2,075 | 2,888 | 4,310 | 7,102 | 13,851 | 37,548 | 213,000 |
| Median Genes per SupSpot | 9,082 | 4,841 | 3,962 | 3,053 | 2,137 | 1,284 | 551 | 111 |
| Median UMI Counts per SupSpot | 54,596 | 14,645 | 10,474 | 6,998 | 4,221 | 2,131 | 767 | 130 |
| Total Genes Detected | 29,175 | 29,170 | 29,182 | 29,181 | 29,175 | 29,191 | 29,190 | 29,196 |
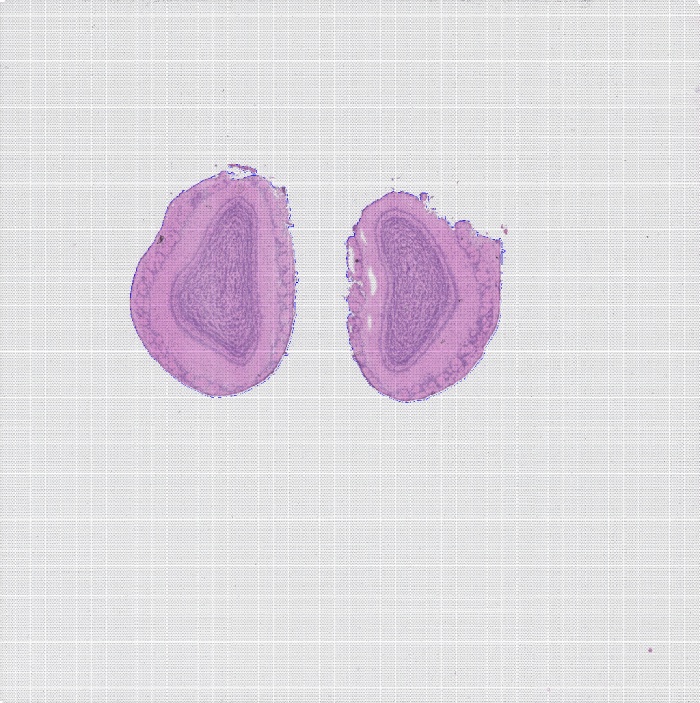
图1 组织切片HE染色图
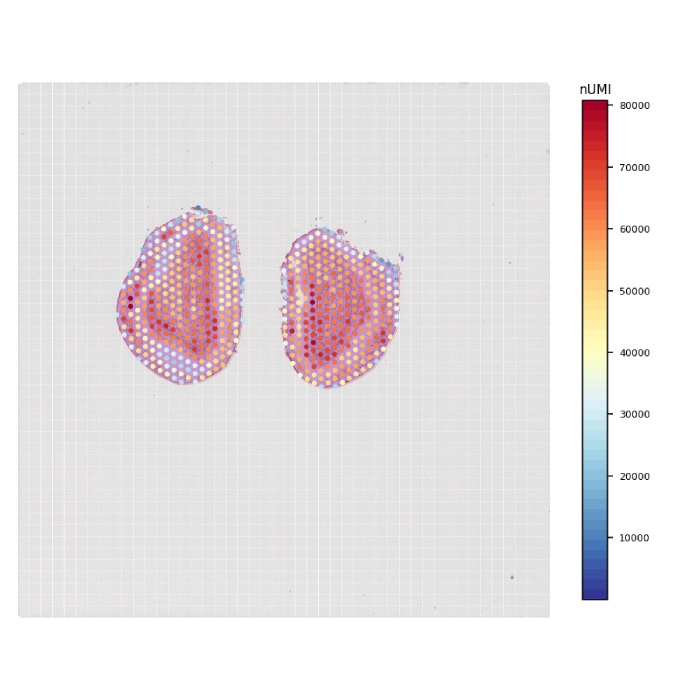
图2 组织UMI count统计图
聚类分析
L13 cluster聚类图L7 cluster聚类图L5 cluster聚类图
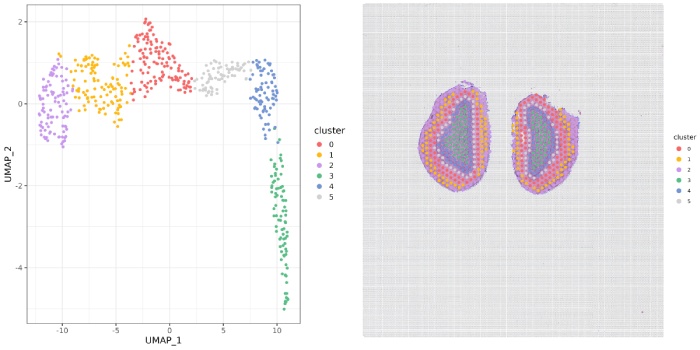
图3 cluster聚类图
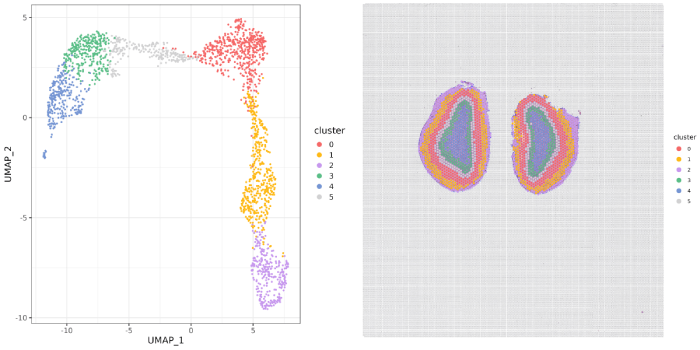
图3 cluster聚类图
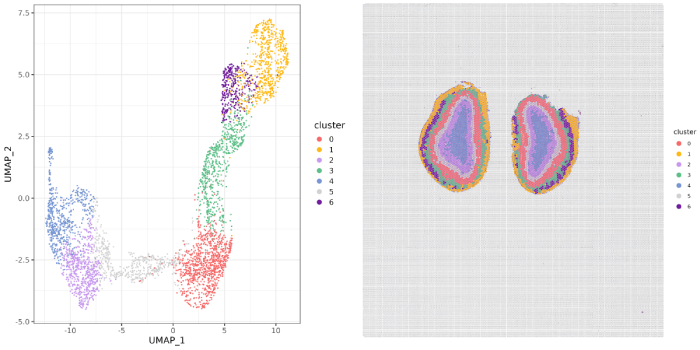
图3 cluster聚类图
细胞分割
Summary组织切片荧光图组织切片HE分割图组织切片荧光分割图细胞分割聚类图
| Type | Value |
|---|---|
| Number of Cells | 17,567 |
| Median Genes per Cells | 1,165 |
| Median UMI Counts per Cells | 1,786 |
| Total Genes Detected | 29,059 |
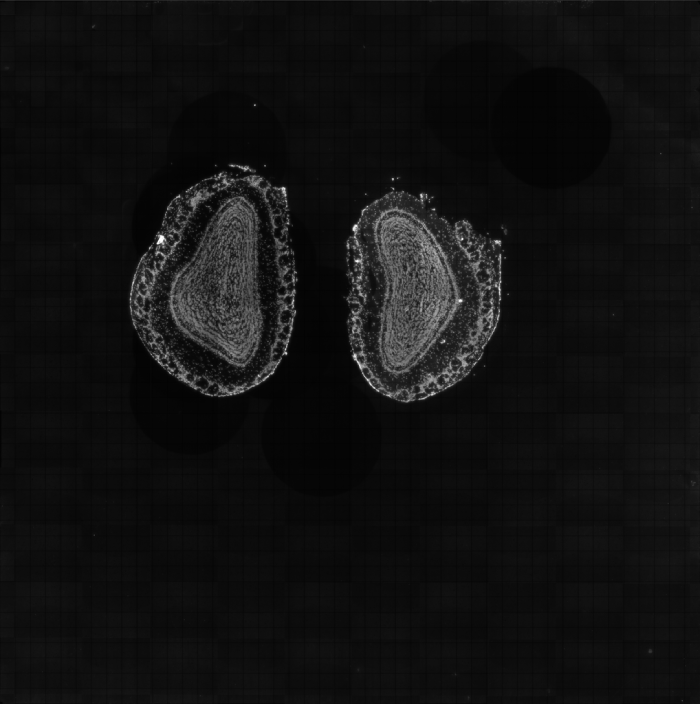
图4 组织切片荧光图
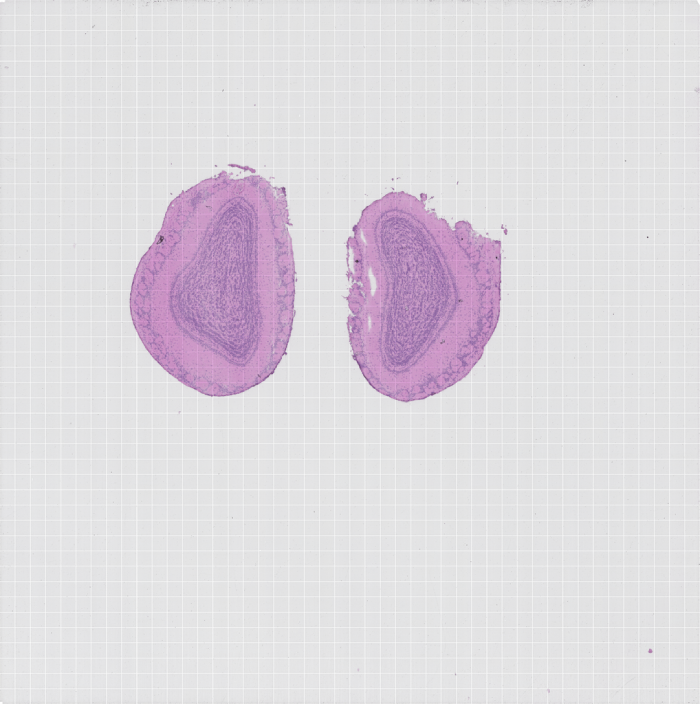
图5 组织切片HE分割图
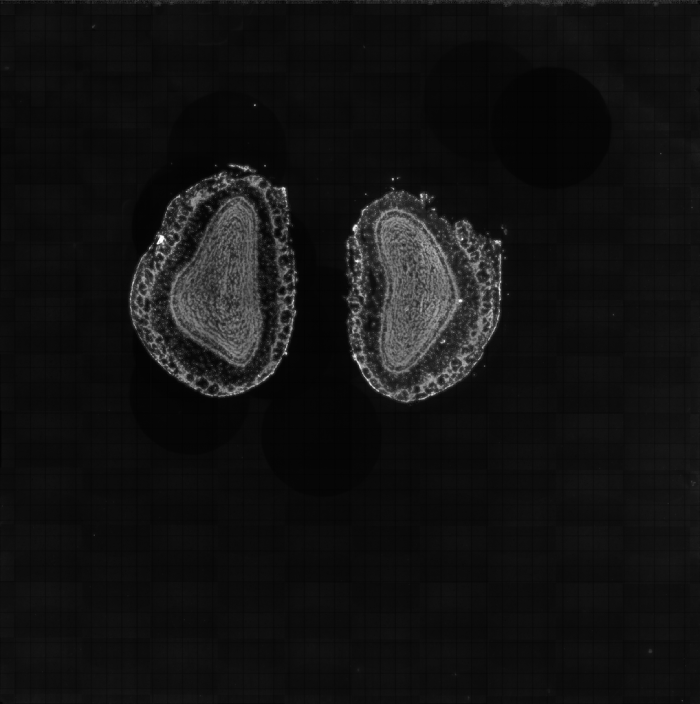
图6 组织切片荧光分割图
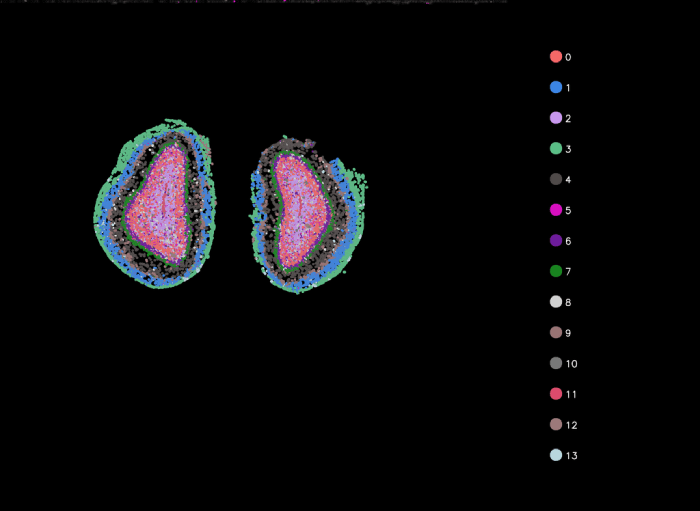
图7 细胞分割聚类图


