
BMKMANU S1000小鼠胚胎头部Demo数据结果展示

BSTMatrixONT流程说明
2022年9月27日
BMKMANU DG1000 人PBMC测序数据详情
2022年11月23日
样本类型:小鼠胚胎头部
公开日期:2022-11-22
更新日期:2022-11-22
Demo数据结果展示
1、测序reads数据统计
表1 测序数据统计
| Type | Values |
| Number of Reads | 432790558 |
| Valid Barcodes | 391592770 |
| Valid UMIs | 429025869 |
注:
Number of Reads:reads总数;
Valid Barcodes:包含有效Barcode的reads数 ;
Valid UMIs:包含有效UMIs的reads数。
2、数据比对结果统计
表2 比对结果统计
| Type | Values |
| Reads Mapped to Genome | 96.46% |
| Reads Mapped Confidently to Genome | 77.42% |
| Reads Mapped Confidently to Intergenic Regions | 1.65% |
| Reads Mapped Confidently to Intronic Regions | 1.7% |
| Reads Mapped Confidently to Exonic Regions | 74.06% |
| Reads Mapped Confidently to Transcriptome | 69.05% |
注:
Reads Mapped to Genomes:比对到参考基因组上的Reads在总Reads中占的比例;
Reads Mapped Confidently to Genome:比对到参考基因组并得到转录本GTF信息支持的Reads在总Reads中占的比例;
Reads Mapped Confidently to Intergenic Regions:比对到基因间区域的Reads在总Reads中占的比例;
Reads Mapped Confidently to Intronic Regions:比对到内含子区域的Reads在总Reads中占的比例;
Reads Mapped Confidently to Exonic Regions:比对到外显子区域的Reads在总Reads中占的比例;
Reads Mapped Confidently to Transcriptome:比对到已知参考转录本的Reads在总Reads中占的比例。
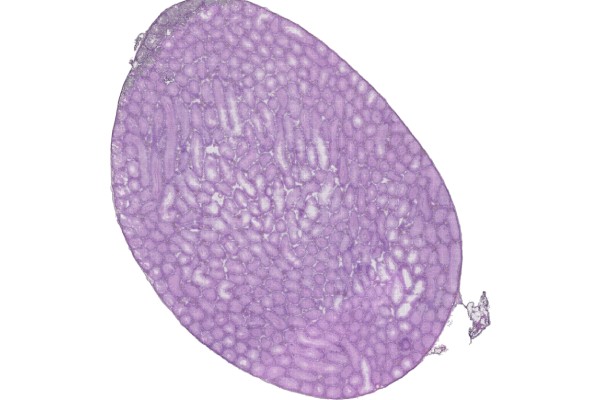
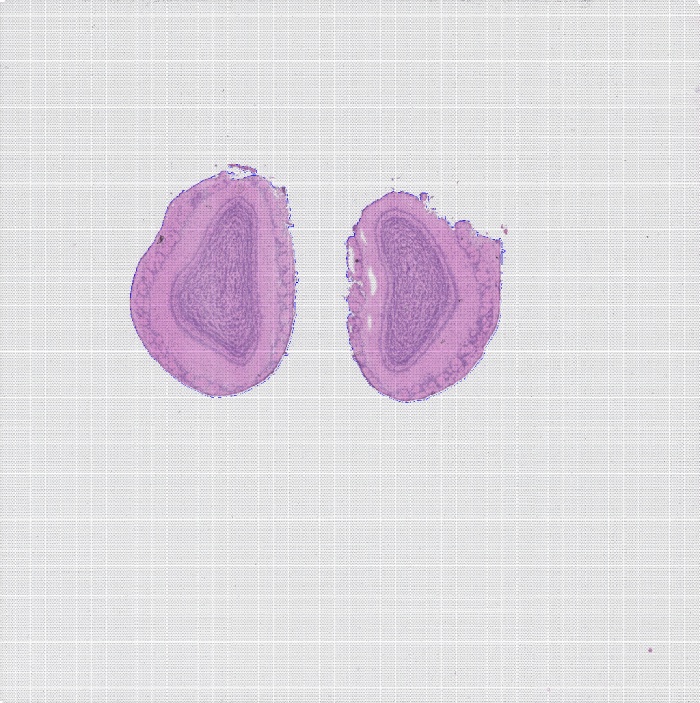
3、图像处理
每个玻片上都有Spots,实验时被组织切片覆盖,但是切片只会覆盖到部分Spots,实验时也只会获得覆盖区域下Spots中的基因表达。
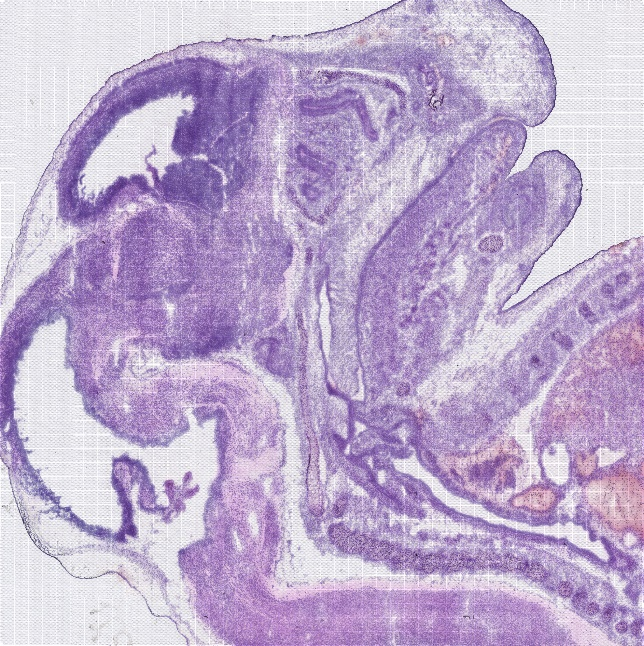
图1 组织切片HE染色图
4、Spots统计
空间转录组的基因表达定量,主要基于UMI计数来实现的。通过UMI可以区分一条read是属于生物学重复还是技术重复,能够有效地去除PCR效应。对每个Barcode下的基因去除重复的UMI,统计unique UMI数目即表示细胞基因的表达量。分析统计如下:
表3 Spots统计
| Type | Values |
| Sequencing Saturation | 56.80% |
| Percent of Spots Under Tissue | 79.17% |
注:
Sequencing Saturation:测序饱和度;
Percent of Spots Under Tissue:切片组织下Spots的比例。
表4 不同水平Spots统计
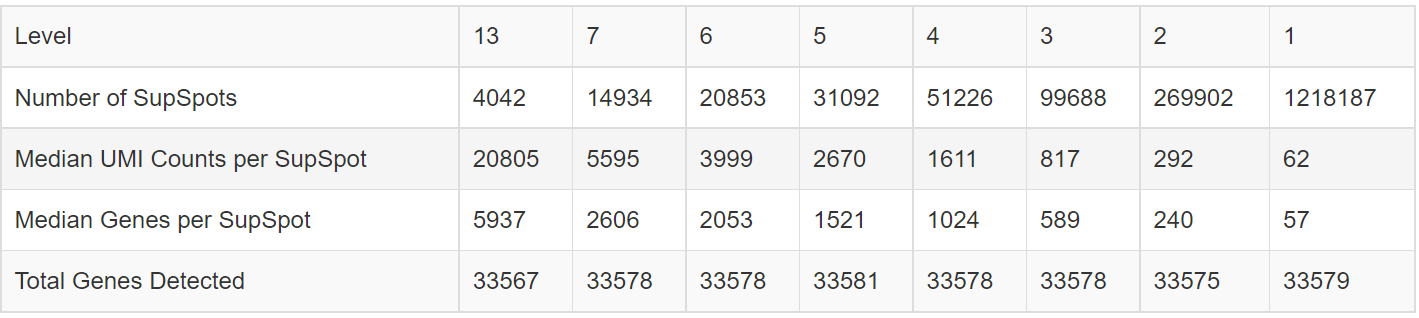
注:
Level:分辨率水平;
Number of SupSpots:一个或多个spot合并成的supspot个数;
Median UMI Counts per SupSpot:每个SupSpot的UMI中位数;
Median Genes per SupSpot:每个SupSpot中基因数目的中位数;
Total Genes Detected:基因总数。
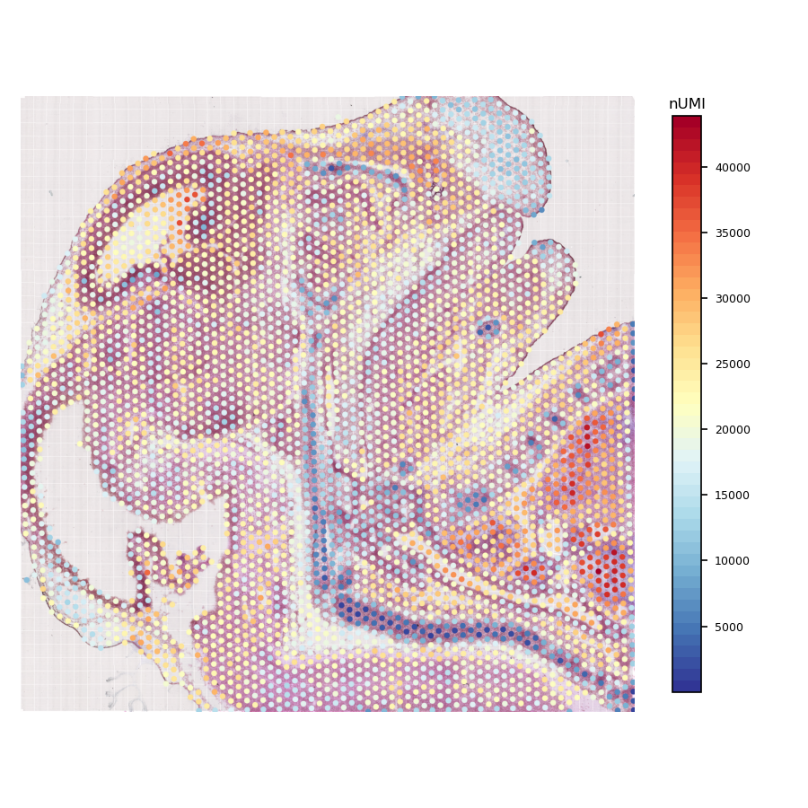
图2 组织UMI count统计图
5、分辨率水平说明
百创S1000芯片可实现多级分辨率分析。通过调整supspot level参数,选取不同大小的spot点数作为分析单元,可以实现不同分辨率的数据分析和数据挖掘,最高分辨率supspot level 1可达到5um亚细胞水平。
表5 supspot level分辨率表
| SupSpot Level | 分辨率 | Spot点数 |
| 13 | 100um | 469 |
| 7 | 50um | 127 |
| 6 | 42um | 91 |
| 5 | 35um | 61 |
| 4 | 27um | 37 |
| 3 | 20um | 19 |
| 2 | 10um | 7 |
| 1 | 5um | 1 |
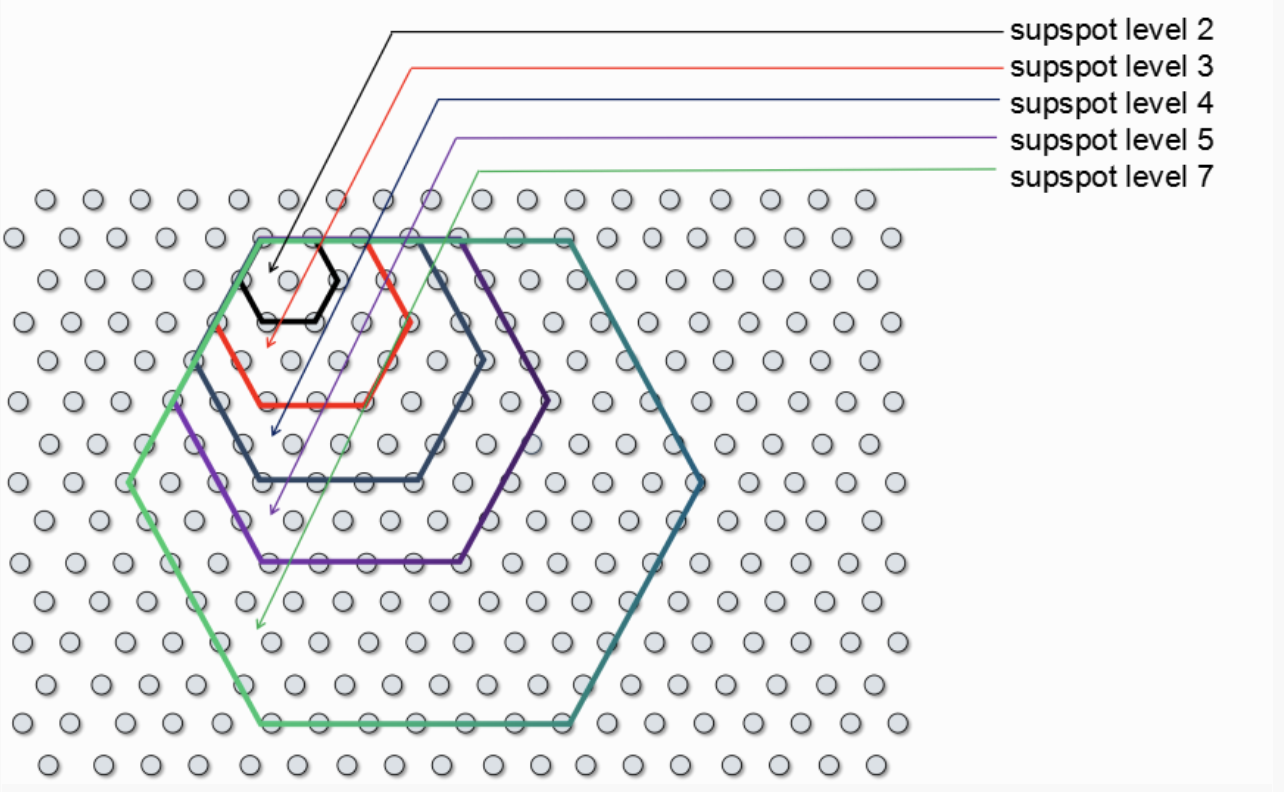
图3 supspot level与spot点数图


