
Cluster plot软件使用说明

S1000 Seurat分析流程
2022年8月3日Bmk_Space_mapping.R 操作说明
2022年8月25日环境要求
R(Seurat,dplyr,tibble,ggplot2,getopt)
Python3(numpy,cv2,pandas,seaborn,sys,getopt)
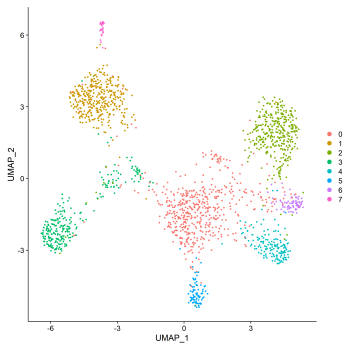
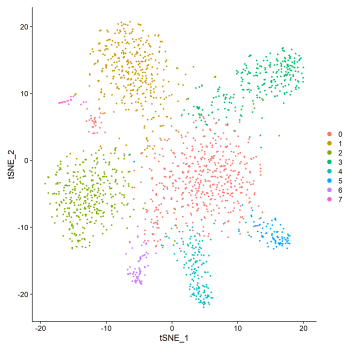
spots 聚类
脚本:Seurat_for_bmkmanu_S1000.R
说明: seurat_for_bmkmanu_S1000.R [-[-indir|i] <character>] [-[-resolution|r] <double>] [-[-MinCell|c] <double>] [-[-MinFeatures|g] <double>] [-[-outdir|o] <character>] [-[-help|h]]
-i|–indir 输入目录(下载数据中 05.AllheStat/BSTViewer_project/subdata/下任意一个 level 的目录)
-r|–resolution 聚类调整,默认 0.5
-c|–MinCell 最小细胞数,默认 5
-g|–MinFeatures 最低基因数,默认 100
-o|–outdir 最输出目录
-h|–help 帮助文档
示例:Rscript seurat_for_bmkmanu_S1000.R
-i /home/05.AllheStat/BSTViewer_project/subdata/L13_heAuto/
-o /home/outdir
-r 0.5
-c 5
-g 100
结果:
outdir/
├ UMAP.p*
├ cluster.csv (下一步绘图需要的输入) └─t-SNE.p*
绘图
脚本:bmplot.py
说明: python bmplot.py
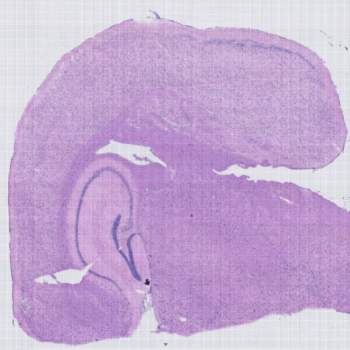
-e||–he_file 修剪之后的HE 图片
-p||–pos_file barcodes 的空间位置(下载数据中05.AllheStat/BSTViewer_project/subdata/下任意一个level 的目录下的barcodes _pos.tsv.gz )
-c||–cluster_file 步骤2 中得到的聚类文件
-o||–outfile 输出文件名
-h||–help 帮助文档
示例:python3 bmplot.py
-e /root/05.AllheStat/BSTViewer_project/he.tif
-p /root/05.AllheStat/BSTViewer_project/subdata/L13_heAuto/barcodes _pos.tsv.gz
-c /root/outdir/test/cluster.csv (上一步输出文件)
-o /root/outdir/test/L13.tif
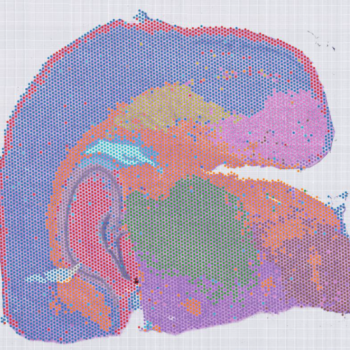
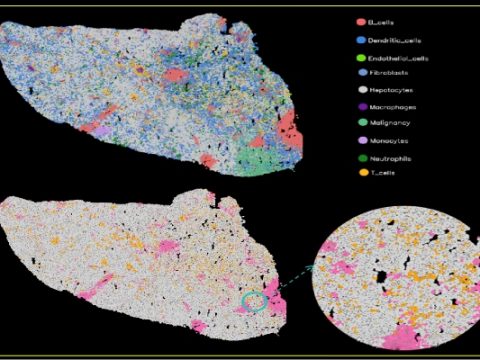
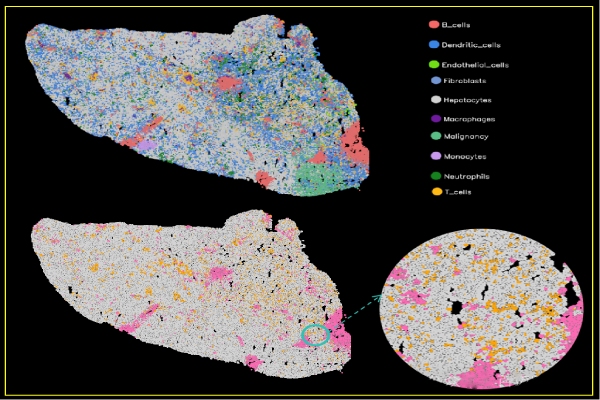
结果
结果展示:
附:

